
Stop Guessing. Start Trading a Clear Edge with TAS Charts
Most traders lose money because their charts don't tell them the full story. TAS Market Profile Indicators reveal what the market is actually doing and at what price zones, so you can trade with confidence and stop second-guessing every move.


TAS Market Map (FREE)
Price alone never tells the full story — and that gap is what costs most traders money. The TAS Market Map uses proprietary volume analysis to show you exactly where the market has accepted and rejected price, so you always know where the real opportunity is.
See Exactly Where Institutional Money is Entering and Exiting
Spot the Best Setups — and Know Which Ones to Skip
Get It FREE With Our Introductory Trading Class
TAS Boxes
Hesitation kills trades. TAS Boxes maps out your complete strategy in advance — precise entries, trailing stops, and profit targets plotted directly on your chart.
Enter Every Trade With Your Entry, Stop, and Target Pre-Defined
Know Precisely When to Exit — Win or Lose
Execute Your Strategy with Zero Second-Guessing

Commercial
Lorem Ipsum is simply dummy text of the printing and typesetting industry. Lorem Ipsum has been the industry's standard dummy text ever since the 1500s,when an unknown printer took a galley.
Lorem Ipsum is simply dummy tex.
Lorem ipsum is simply.
Lorem ipsum is simply.
Lorem ipsum is simply.

TAS Vega
Trading against a fast-moving market breakout (or breakdown) is one of the fastest ways to lose money. TAS Vega's color-coded price bars make directional bias and breakouts unmistakable at a glance, so you're always trading with the market — not against it.
Pinpoint Market Breakouts and Breakdowns — and Trade Them with Conviction
Hold Winners Longer With Visual Trend Confirmation
Catch Reversals the Moment Momentum Shifts
TAS Compass
Never enter a trade without knowing which direction the market is leaning. TAS Compass delivers an instant, unambiguous read of market bias through a distinct colored background — bullish or bearish, confirmed before you commit.
Trade Knowing the Prevailing Bias is Confirmed and On Your Side
See Bias Shifts in Real-Time — Never Miss a Turn
Filter Every Decision Through Directional Bias Clarity
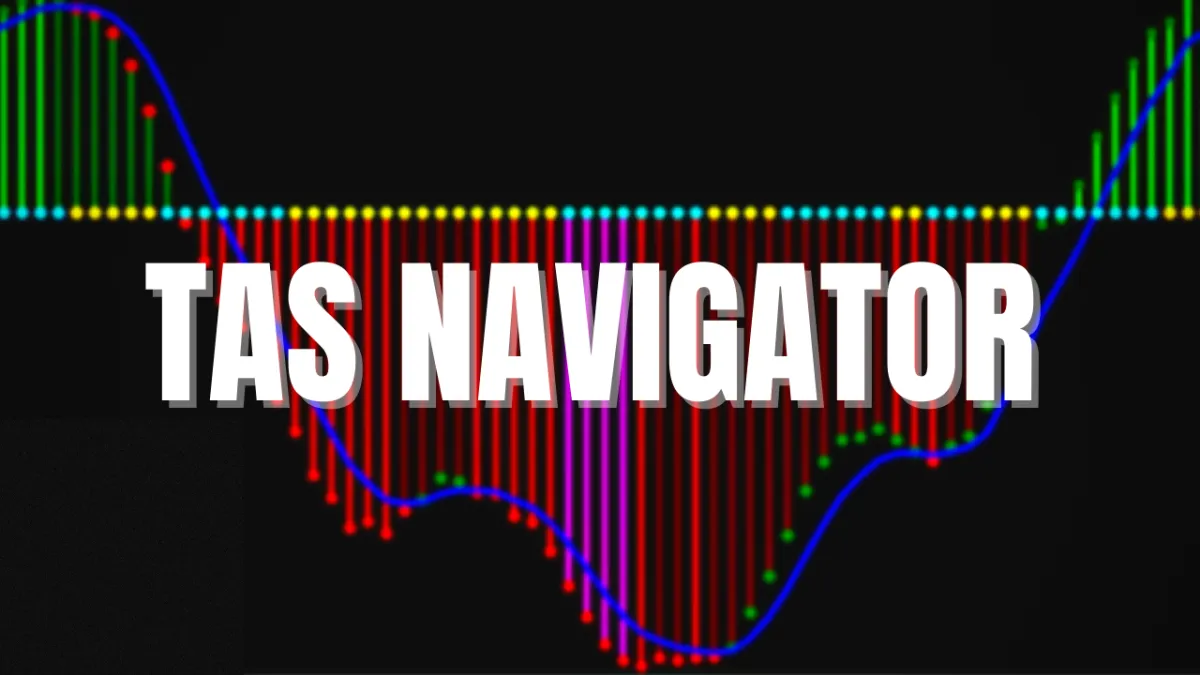
TAS Navigator
Chasing momentum is expensive — entering just as a trend runs out of steam is one of the most common and costly mistakes traders make. TAS Navigator shows you in real-time who controls momentum and warns you in advance when the market is overextended and primed to reverse.
Objectively Pinpoint Overbought and Oversold Conditions
Avoid Late Entries with Bold, Color-Coded Histogram Cues
Ride Strong Trends Longer with Data-Backed Confidence
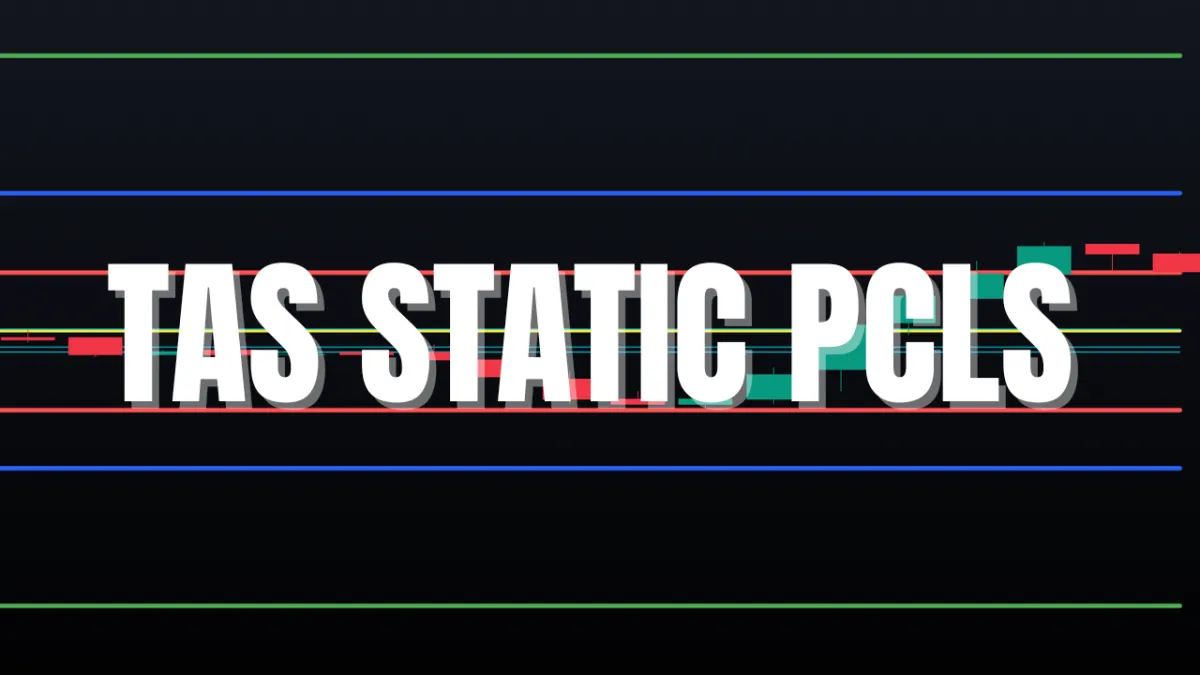
TAS Static PCLs
Discretionary support and resistance levels are based on opinion — and they fail traders constantly. TAS Static PCLs deliver institutional-grade price compression levels grounded in real TAS Profile data, so you always know exactly where price is likely to react.
Replace Guesswork S/R Levels with TAS Profile Price Zones
Trade from Pro-Grade Price Compression Levels for a Real Edge
Know Your Profit Targets Before You Enter
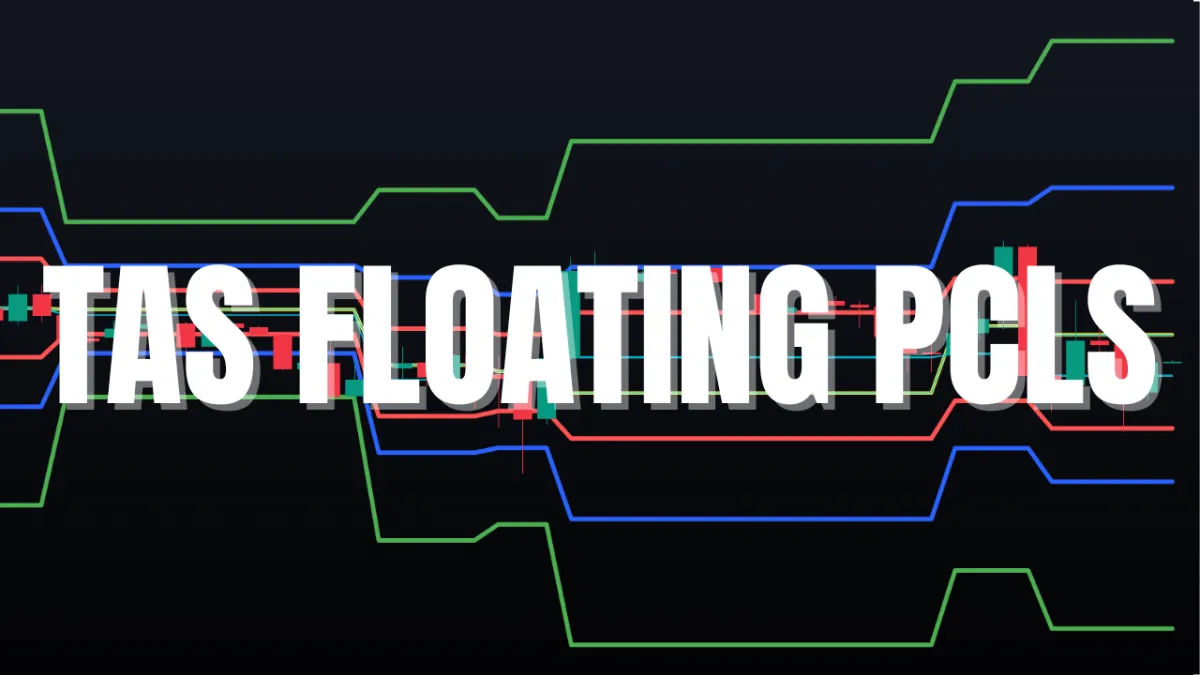
TAS Floating PCLs
Static levels work — until volatility spikes and the market stops respecting them. TAS Floating PCLs recalculate dynamically in real-time, so your exit levels always reflect current market conditions, not yesterday's chart.
Exit Levels that Auto-Adjust to Live Market Volatility
Gauge Profit Potential Before You Deploy Any Strategy
Trade with Levels Built for the Hard Right Edge, Not in Hindsight
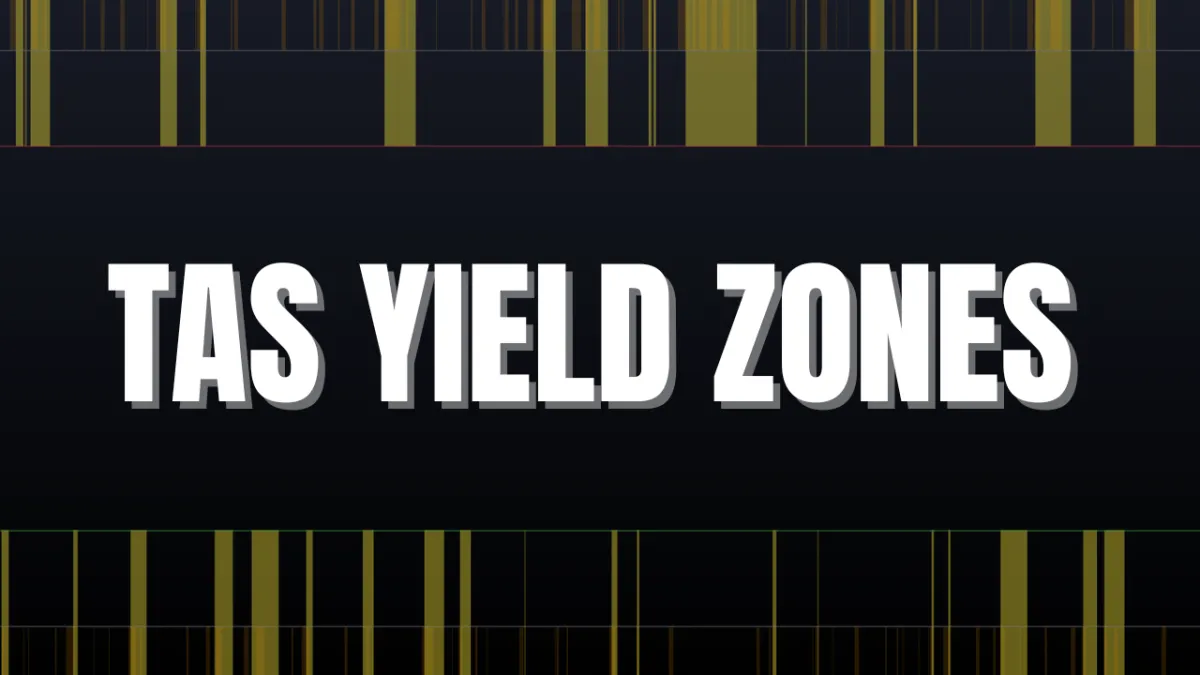
TAS Yield Zones
Getting caught in an overextended market without warning is how good trades turn into bad ones. TAS Yield Zones alerts you when conditions become overbought or oversold — so you can act before the market corrects.
Set Custom Warning Thresholds to Match Your Exact Strategy
Run Multiple Warnings for Layered Market Awareness
Personalize Colors So Nothing Slips Past You
TAS Ratio
In fast-moving intraday markets, reversal timing is everything — seconds too late and a winning setup becomes a losing one. TAS Ratio's finely tuned sensitivity filter surfaces early cues of reversals and countertrend opportunities before they become obvious to everyone else.
Get Early Reversal Cues Before the Move Becomes Obvious
Stay in Winning Trades Longer — With Confidence, Not Hope
Exit Losing Trades Earlier Before the Damage Compounds
Attend Our FREE Trading Class and We'll Gift You the TAS Market Map!
Leverage the TAS Market Map Indicator 100% FREE When You Complete Our Introductory Online Class.
✦ What Members Are Saying...
About Our Training and Private Community
When you become a member, you're part of our trading family.
The content of the training is really good! It's very easy to understand.

My favorite thing is the back-and-forth, and sharing of ideas.

There's an honest intention that everyone works together.


Helping traders like you build the confidence, clarity, and control to trade on your own terms — since 2009.
Email: [email protected]
Phone: (312) 985-7920
Quick links
Copyright 2026 Candid Commodities, LLC DBA Candid Trading. All Rights Reserved.
RISK DISCLOSURE STATEMENT:
THERE IS A RISK OF LOSS IN TRADING STOCKS, ETFS, COMMODITY FUTURES, DERIVATIVES, OPTIONS, FOREX AND CRYPTOCURRENCIES. THIS RISK CAN BE SUBSTANTIAL AND THEREFORE INVESTORS SHOULD CAREFULLY CONSIDER THEIR FINANCIAL SUITABILITY PRIOR TO TRADING. PAST PERFORMANCE IS NOT INDICATIVE OF FUTURE PERFORMANCE. THE SOFTWARE, STRATEGIES, CHATROOMS, WEBSITES AND ANY ASSOCIATED WEBSITES OR DIGITAL VENUES ARE FOR EDUCATIONAL PURPOSES ONLY AND SHOULD NOT BE CONSTRUED AS AN EXPRESS OR IMPLIED PROMISE OR GUARANTEE THAT YOU WILL PROFIT OR THAT LOSSES MAY BE LIMITED IN ANY MANNER WHATSOEVER. USERS OF THE INFORMATION ACCEPT SOLE RESPONSIBILITY FOR THE OUTCOMES OF THEIR DEPLOYMENT AND HOLD CANDID COMMODITIES, LLC DBA CANDID TRADING AND ANY ASSOCIATED COMPANIES, AGENTS, MANAGEMENT, OWNERS, EMPLOYEES, INDEPENDENT CONTRACTORS AND CUSTOMERS HARMLESS WITHOUT RESERVATION. PLEASE TRADE RESPONSIBLY.
TESTIMONIALS DISCLOSURE:
ANY TESTIMONIALS ABOUT THE PRODUCTS AND SERVICES ON THIS OR ANY AFFILIATED WEBSITES, DIGITAL VENUES, SOCIAL MEDIA, PRINT MEDIA OR IN PERSON MAY NOT BE REPRESENTATIVE OF OTHER CUSTOMERS AND IS NOT A GUARANTEE OF FUTURE PERFORMANCE OR SUCCESS. THE TESTIMONIALS REPRESENT A MOMENT IN TIME AND CUSTOMER SATISFACTION LEVELS ARE SUBJECT TO CHANGE WITHOUT NOTICE. THE EXPERIENCES SHARED ARE NOT TYPICAL OF WHAT YOU CAN EXPECT TO ACHIEVE AND THE CLAIMS HAVE NOT BEEN VERIFIED. YOUR RESULTS MAY DIFFER MATERIALLY FROM THOSE EXPRESSED DUE TO A NUMBER OF FACTORS. WE DO NOT TRACK THE TYPICAL RESULTS OF OUR CURRENT OR PAST CUSTOMERS. AS A PROVIDER OF EDUCATIONAL INFORMATION, WE DO NOT HAVE ACCESS TO THE PERSONAL TRADING ACCOUNTS OR BROKERAGE STATEMENTS OF OUR CUSTOMERS.
COMMODITY FUTURES TRADING COMMISSION (CFTC) RULE 4.41:
HYPOTHETICAL AND SIMULATED TRADING PERFORMANCE RESULTS HAVE CERTAIN INHERENT LIMITATIONS, SOME OF WHICH ARE DESCRIBED HEREIN. NO REPRESENTATION IS BEING MADE THAT ANY ACCOUNT WILL OR IS LIKELY TO ACHIEVE PROFITS OR LOSSES SIMILAR TO THOSE SHOWN. IN FACT, THERE ARE FREQUENTLY SHARP DIFFERENCES BETWEEN HYPOTHETICAL OR SIMULATED PERFORMANCE RESULTS AND THE ACTUAL RESULTS SUBSEQUENTLY ACHIEVED BY ANY PARTICULAR TRADING PROGRAM. ONE OF THE LIMITATIONS OF HYPOTHETICAL PERFORMANCE RESULTS IS THAT THEY ARE GENERALLY PREPARED WITH THE BENEFIT OF HINDSIGHT. IN ADDITION, HYPOTHETICAL TRADING DOES NOT INVOLVE FINANCIAL RISK, AND NO HYPOTHETICAL TRADING RECORD CAN COMPLETELY ACCOUNT FOR THE IMPACT OF FINANCIAL RISK IN ACTUAL TRADING. FOR EXAMPLE, THE ABILITY TO WITHSTAND LOSSES OR ADHERE TO A PARTICULAR TRADING PROGRAM IN SPITE OF TRADING LOSSES ARE MATERIAL POINTS WHICH CAN ALSO ADVERSELY AFFECT ACTUAL TRADING RESULTS. BECAUSE THESE TRADES HAVE NOT ACTUALLY BEEN EXECUTED, THE HYPOTHETICAL RESULTS MAY HAVE UNDER-OR-OVER-COMPENSATED FOR THE IMPACT, IF ANY, OF CERTAIN MARKET FACTORS SUCH AS LACK OF LIQUIDITY. THERE ARE NUMEROUS OTHER FACTORS RELATED TO THE MARKETS IN GENERAL OR TO THE IMPLEMENTATION OF ANY SPECIFIC TRADING PROGRAM WHICH CANNOT BE FULLY ACCOUNTED FOR IN SIMULATED TRADING OR IN THE PREPARATION OF HYPOTHETICAL PERFORMANCE RESULTS AND ALL OF WHICH CAN ADVERSELY AFFECT ACTUAL TRADING RESULTS.
ALL SUBSCRIPTIONS ARE AUTOMATIC AND RECURRING IN NATURE. THERE ARE NO REFUNDS OR PRORATED RETURN OF FEES ON PAID SUBSCRIPTIONS. TO CANCEL, MEMBERS ARE REQUIRED TO NOTIFY THE HELP DESK A MINIMUM OF 3 DAYS IN ADVANCE OF THE AUTOMATIC RECURRING BILLING DATE BY EMAILING [email protected].